Finixy Gets a Full Landing Page Redesign With a New MIS Dashboard
Sharper design, smarter financial visibility.
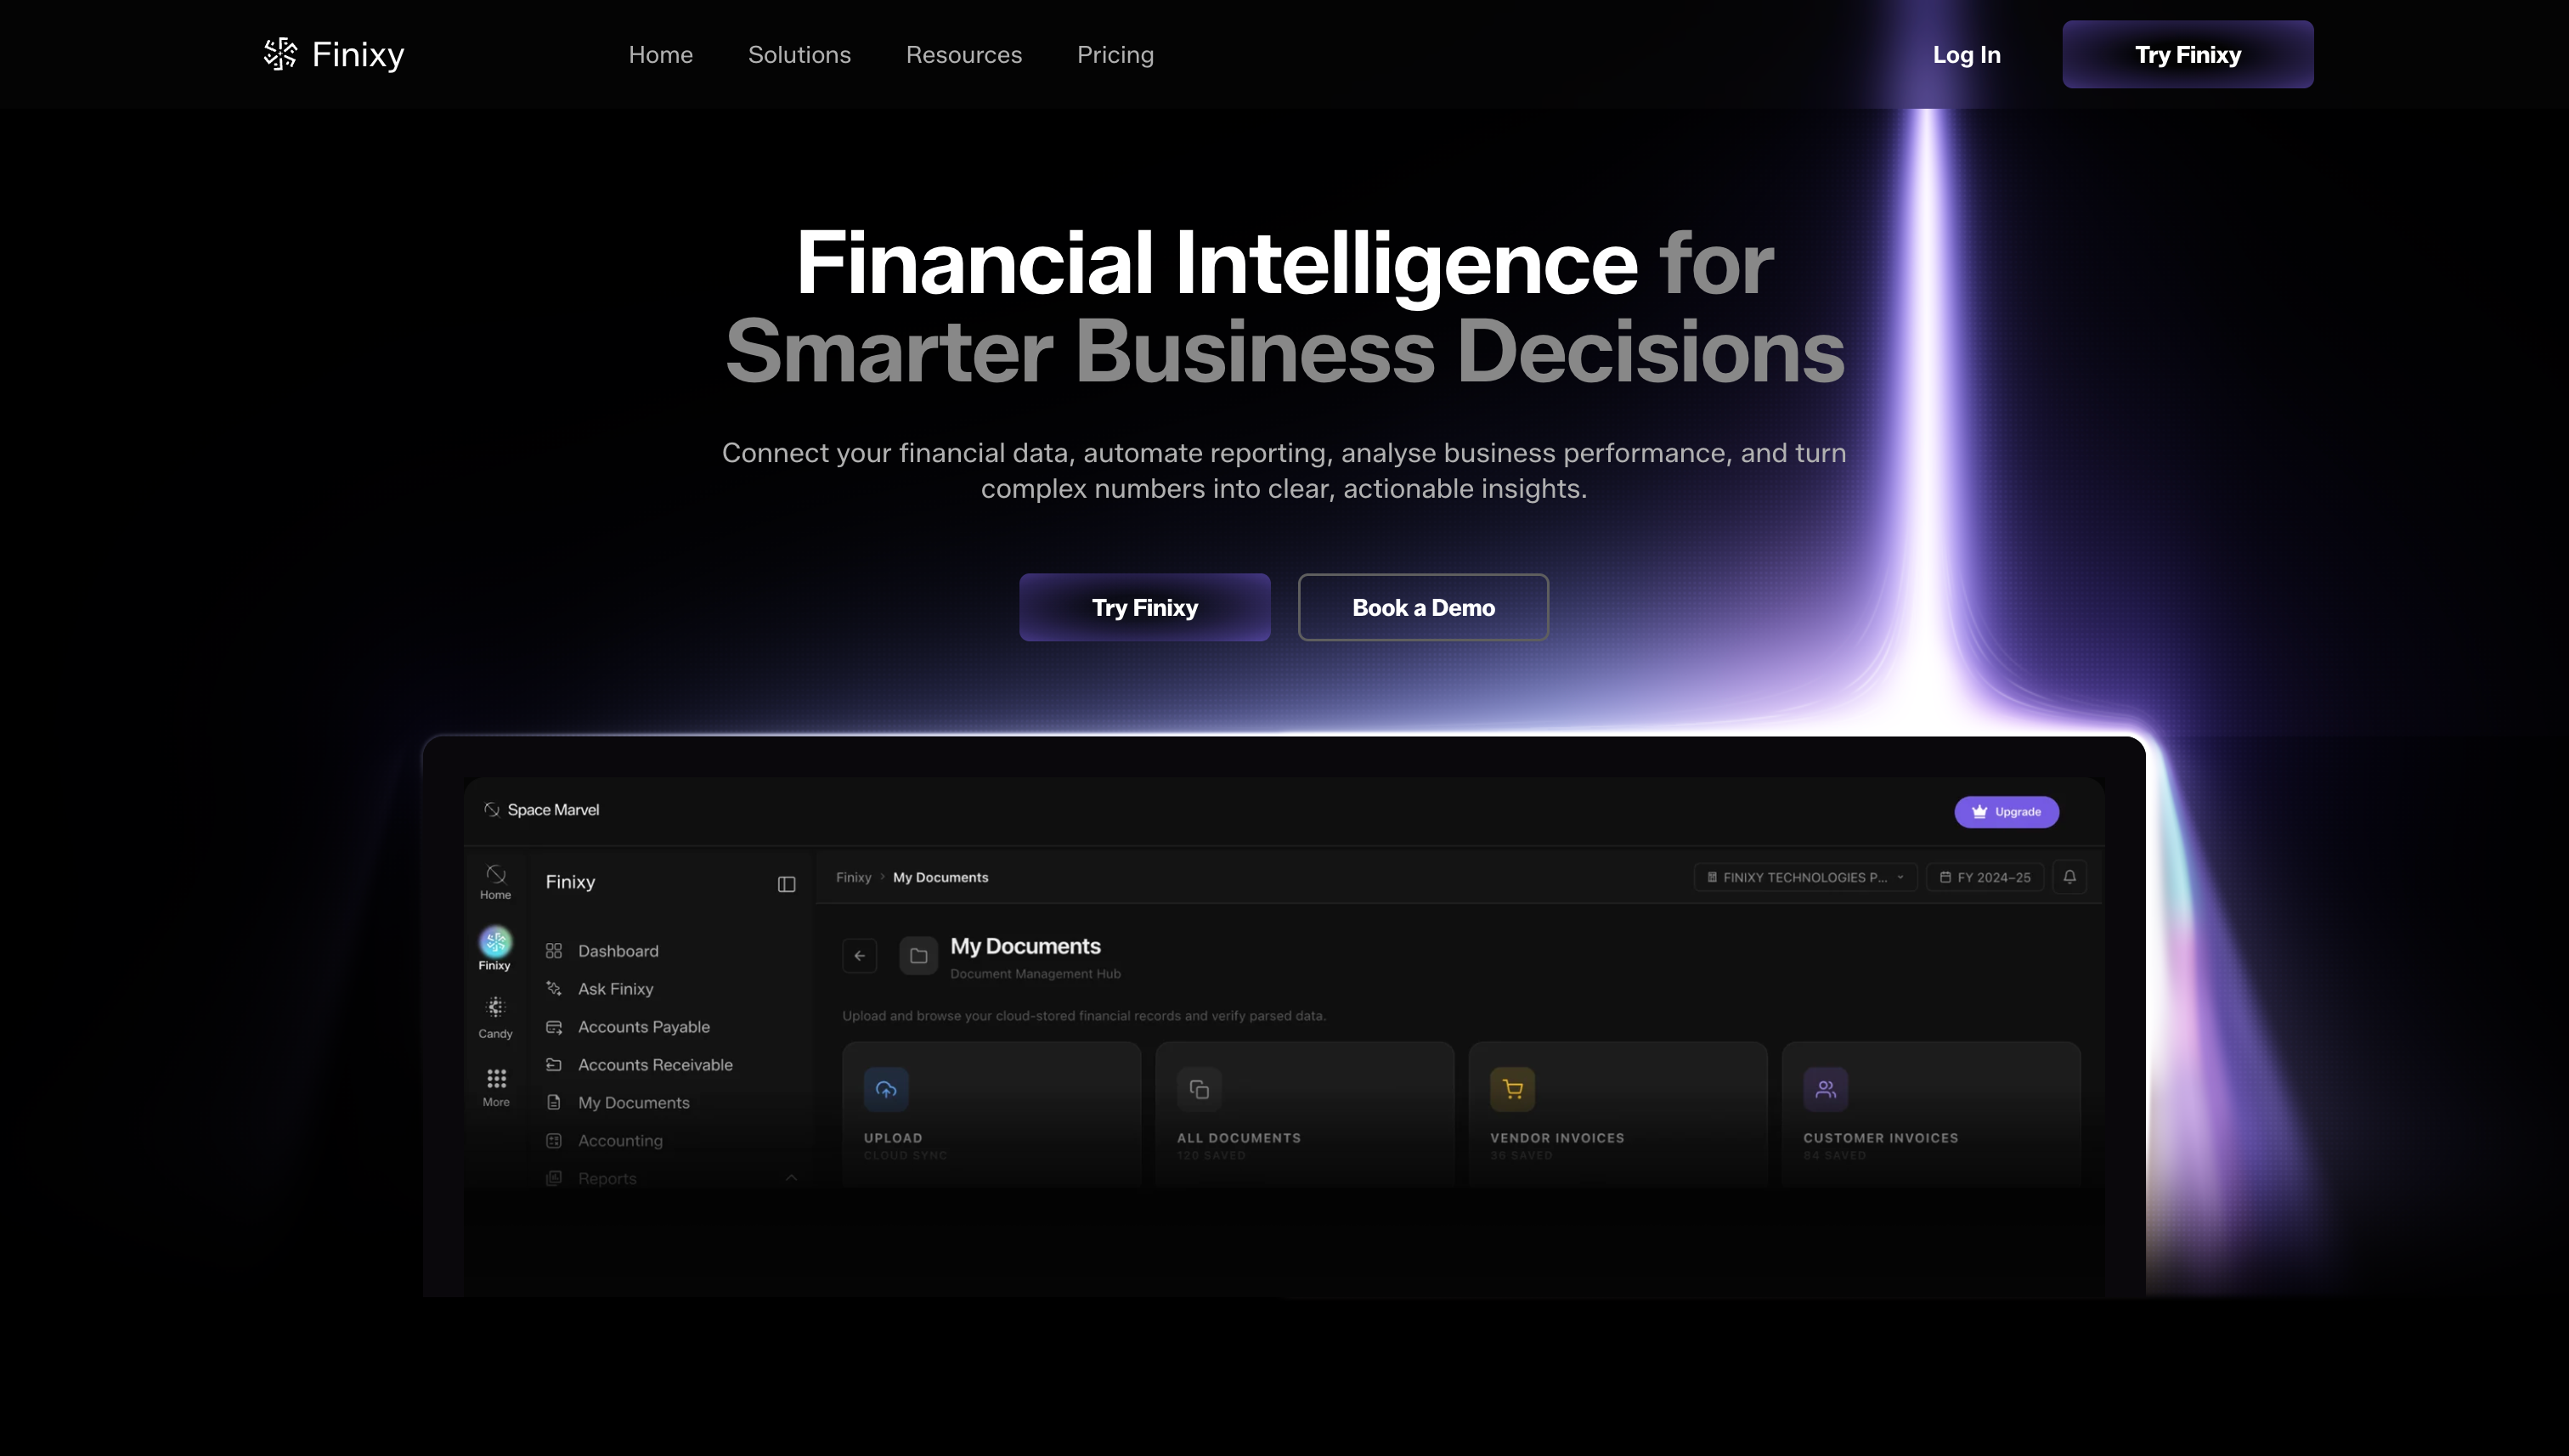
We shipped a significant update to Finixy this month and this one covers a lot of ground. The landing page has been redesigned from scratch. The banner is completely new, the layout is cleaner, and the overall design now better reflects what Finixy actually is — a serious finance AI platform built for companies and CA firms. If you have not visited the Finixy page recently it looks and feels like a different product. The bigger addition is what you see inside the product itself. We have launched the Overall Financial Performance and Business Insights Dashboard — a real time visual summary of your company’s complete financial picture in one place. Revenue trends, gross profit margins, net profit, operational cost ratios, receivables aging, and cash flow bridge patterns are all visible at a glance without switching between reports or exporting anything manually. The MIS Reports section now includes a Notes to Management panel that surfaces AI generated insights directly on the dashboard. It reads your Zoho, Tally, and Finixy data together and tells you what is actually happening — things like net profit position, receivables concentration, and margin trends — written in plain language rather than numbers you have to interpret yourself. The dashboard also connects to the Virtual CFO view and KPI Dashboard in one unified interface. You can switch between Auto, Finixy, Tally, and Zoho data sources, filter by financial year, quarter, or month, and export everything to PDF in one click.